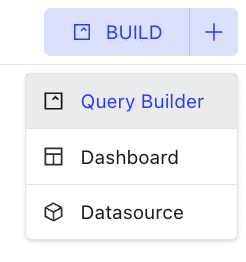
Query Builder
When you click on the Create Query button, you will see ZettaBlock’s Query Builder. The Query Builder is for you to access and analyze data.
The Query Builder has three components:
| Name | Short Description |
|---|---|
| Data Explorer | Choose the data source (toggle between real-time and historical tables). |
| Query Window | Input and execute SQL code. |
| Query Results | See the query results and add new visualizations based on the results. |
1. Data Explorer
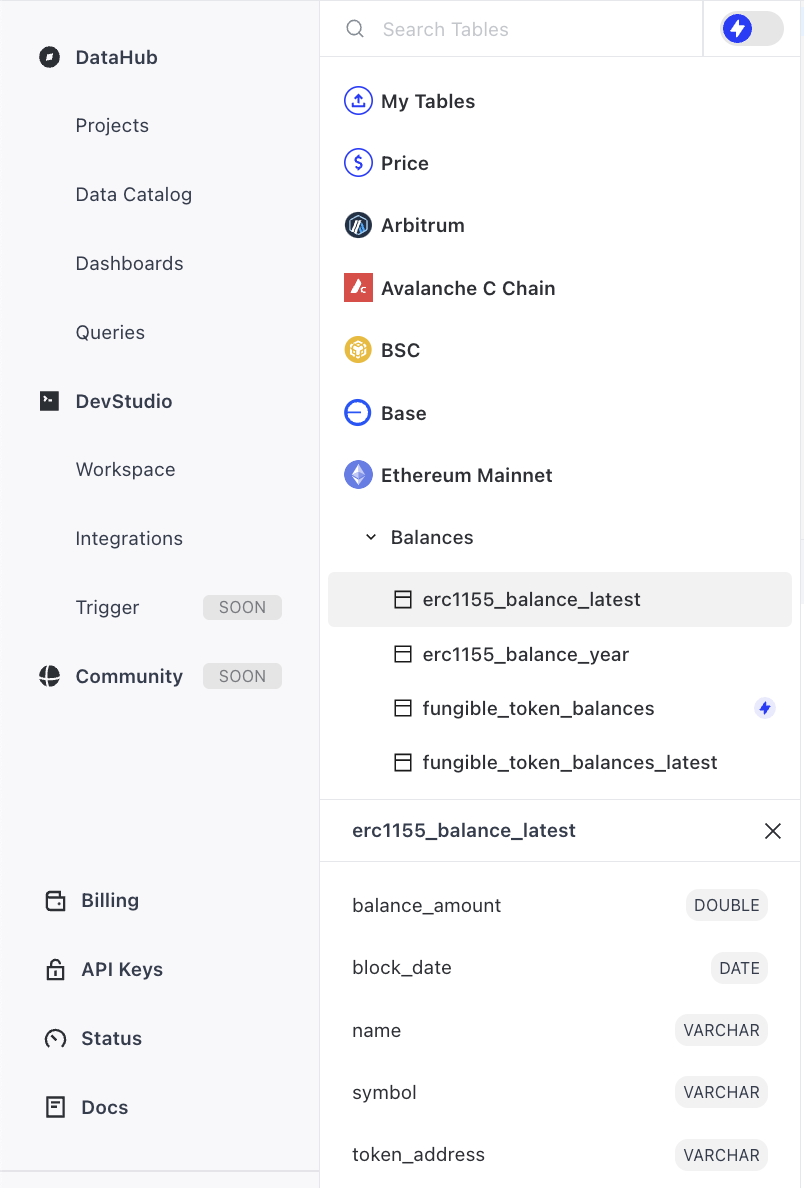
Data explorer is on the left side of the page, which allows you to explore blockchain and other data you are looking for:
- Chain data: chain-specific data, such as data from Ethereum, Arbitrum, etc, usually low-level raw data.
- Abstraction data: Business-level abstraction for projects and sectors built on top of raw-level data, such as NFT trades which aggregates data across multiple NFT platforms into one simple table; those tables can be used to directly answer domain-specific questions without any aggregations.
- Project data: project-specific decoded contract calls and events data stored in easy-to-use tables, such as events from Uniswap, Aave, etc.
Tables
Tables are organized under each database. For example, under “Ethereum_mainnet”, there are tables about Blocks, Contracts, Transactions, Logs, ERC20, etc.
| Class | Short Description | Examples |
|---|---|---|
| Blockchain Data | It includes both raw on-chain data comparable to Etherscan or Polygonscan, and also decoded human-readable data. The raw data is stored in a column named input (a long HEX value), and we decoded it into the following five columns in the table: | For example, one record in the column input of the table ethereum_mainnet.transactions: 0xa9059cbb000000000000000000000000ffec0067f5a79cff07527 has been decoded to the following five columns in the same table: func name: transfer |
Columns
Columns represent fields within each table from selected table. The info displayed includes column names and data types. For example, the columns under erc20_tokens are contract_address, symbol, and decimals. The contract_address‘s data type is varchar.
Preview
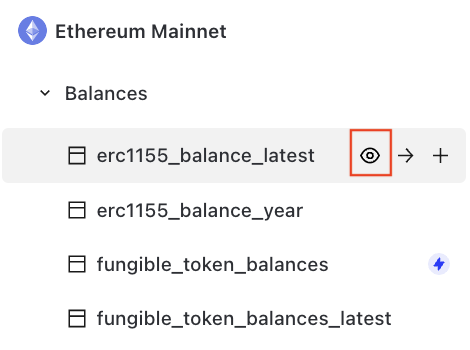
You can click the Preview button to preview the table without writing code
Insert full basic SQL
You can insert the full basic SQL query into the Query Window by clicking this button.
Insert table name

You can insert the table name into the Query Window by clicking this button.
2. Query Window
Query Window is the place where you write and execute your SQL script.
Run & Cancel Query
Leverage our AI-powered query router to automatically choose the database your query will run on.
Click the Run button to execute the SQL script, and click the Cancel button to cancel a running query.
Parameter
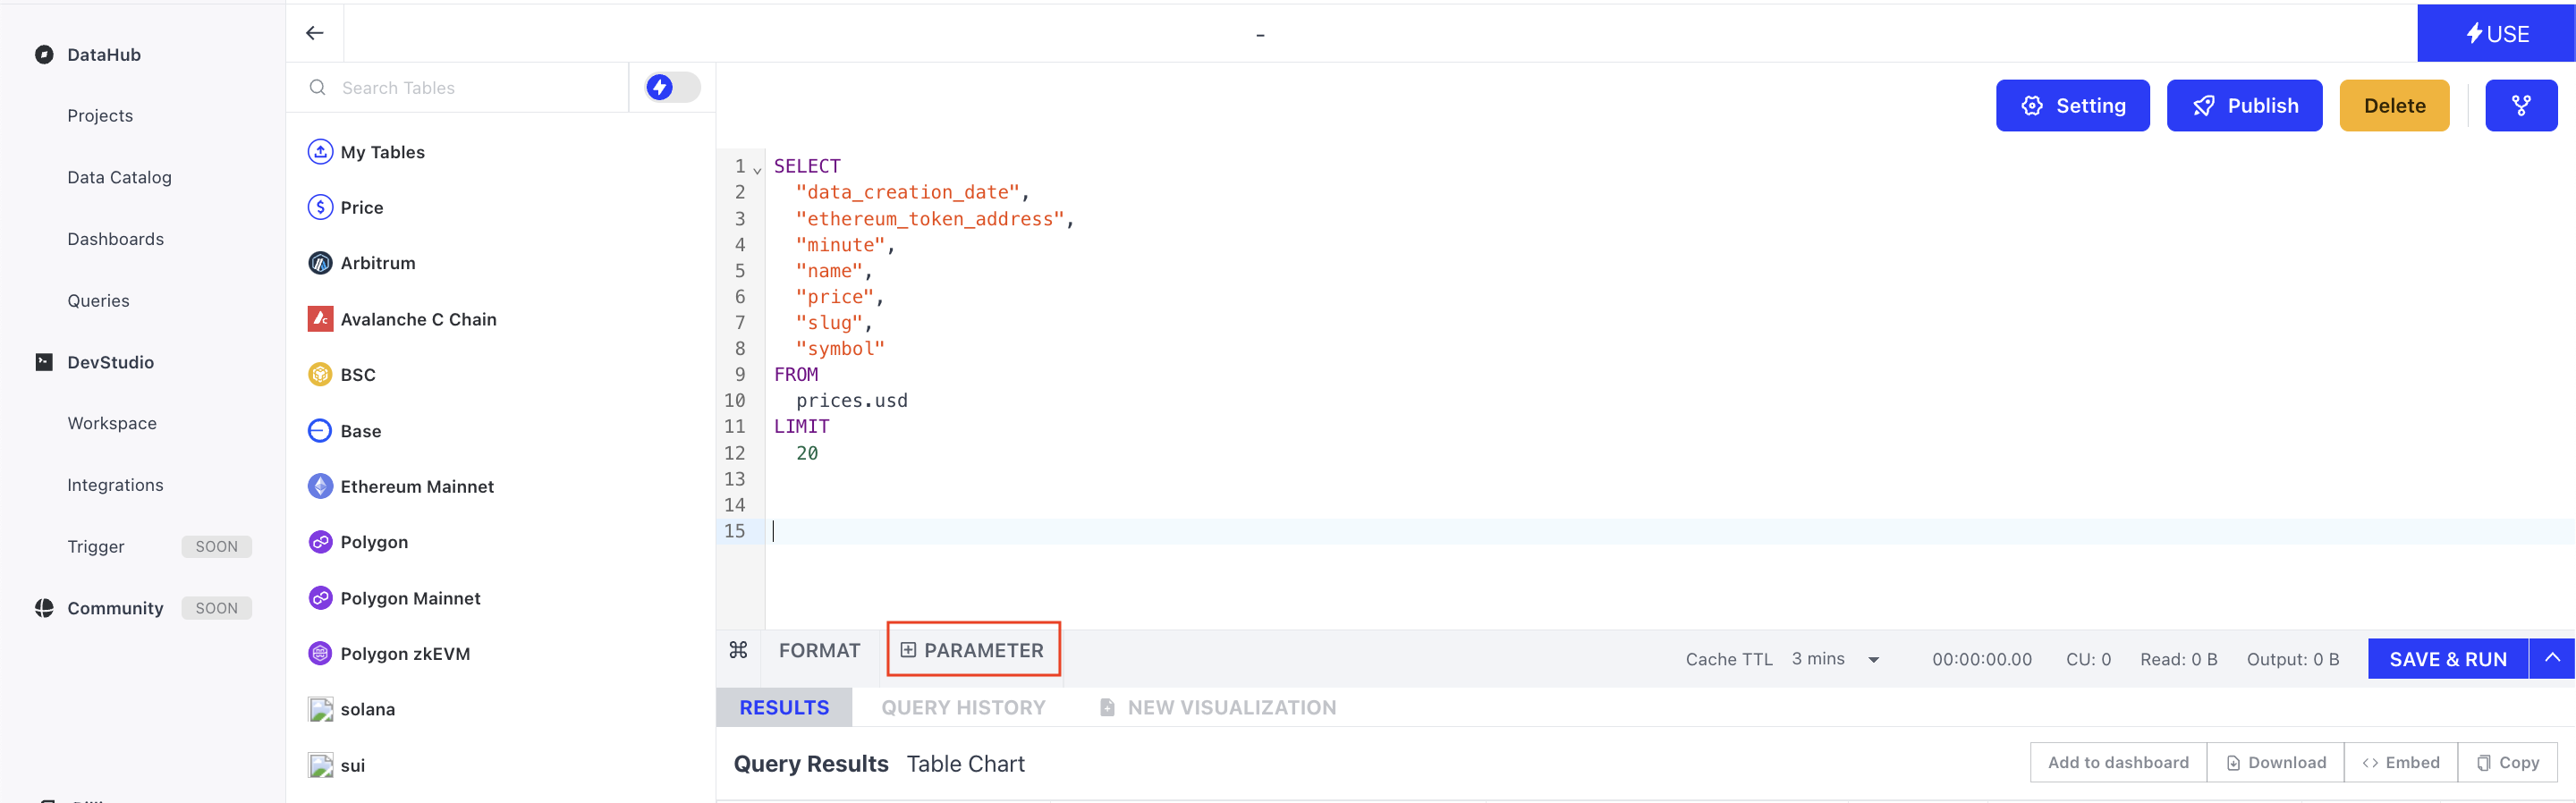
Parameters can be used to simplify your SQL script. For example, you can add a parameter ‘x’ in the query to represent the number of days. To know the data for the past 10 days, you can enter 10 in the parameter bar, and later change it to another value to see results from other ranges.
To use it specifically, click +PARAMETER button to add a parameter in the query. You can name your parameter and change the value.
Note:
- Parameters can further be used in dashboards.
- Parameters are also supported in API builder (more on this soon!).
Format
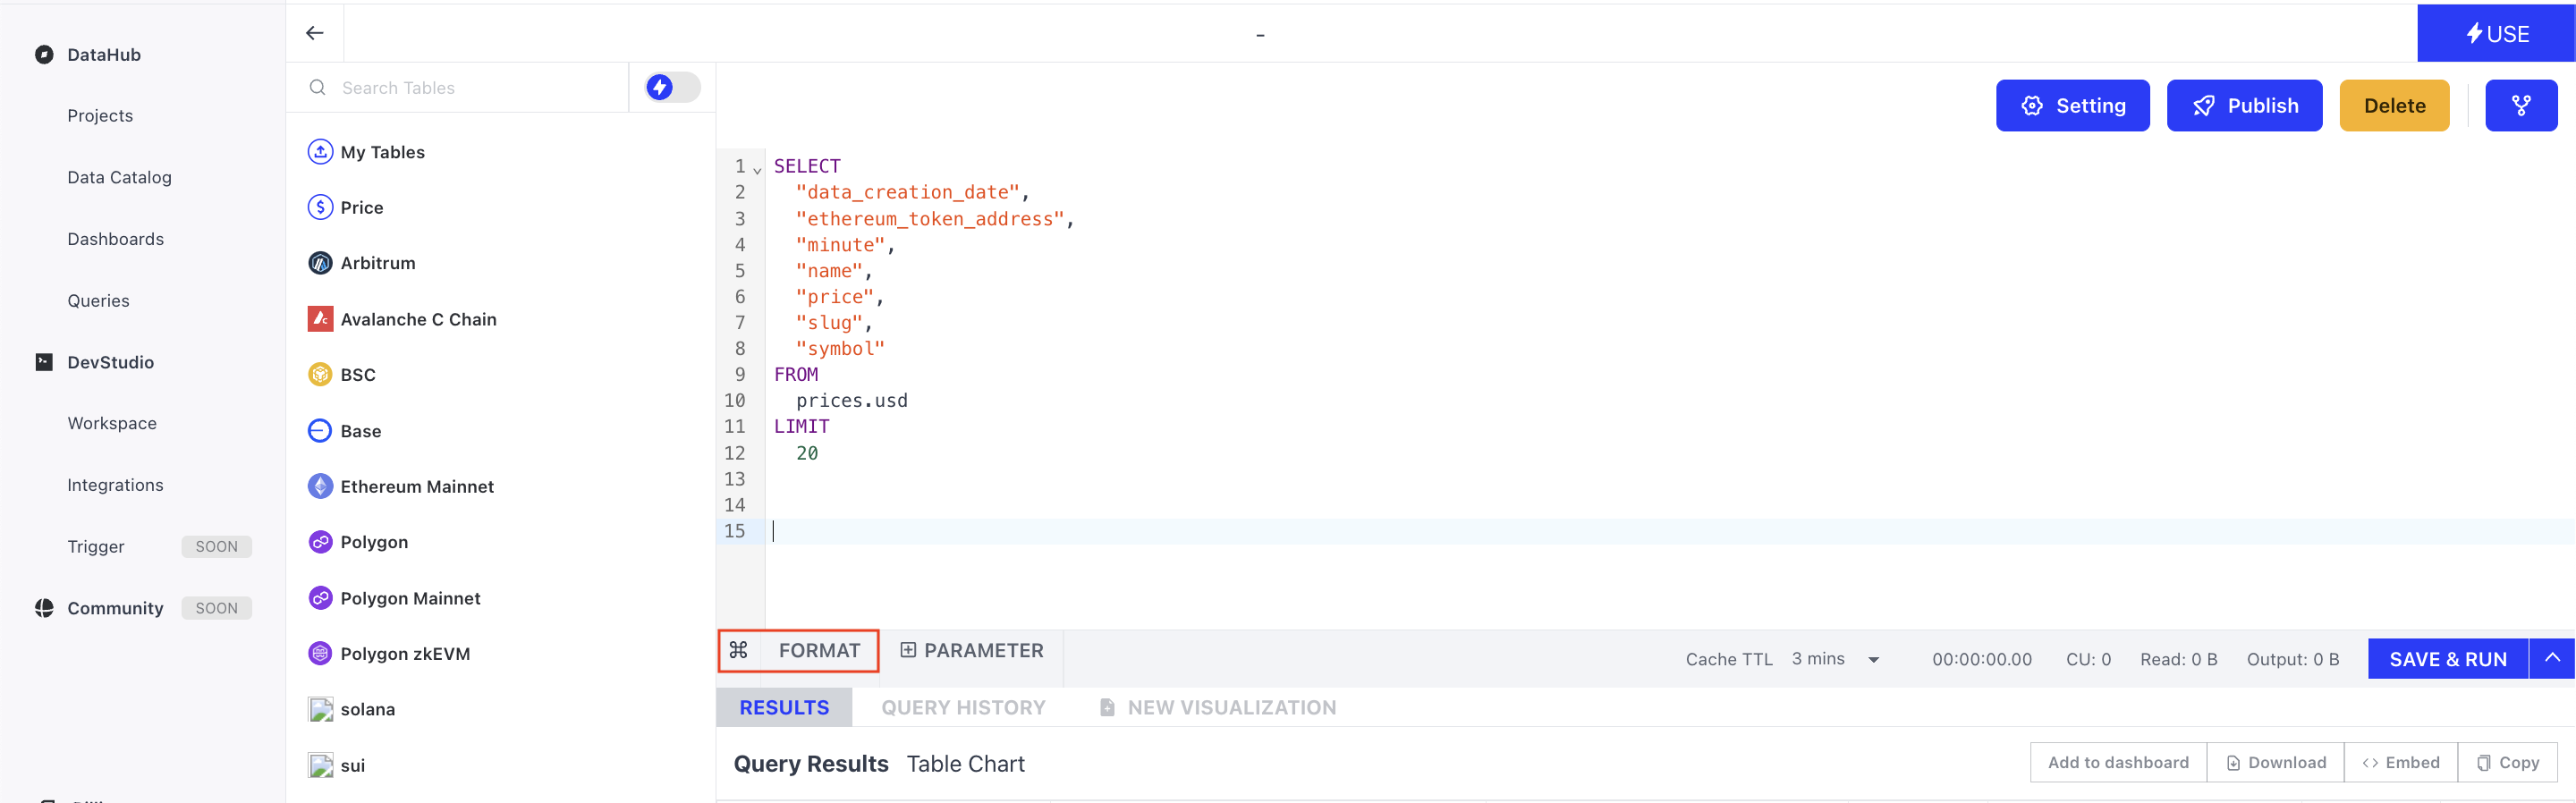
For long and nested query, you can click the Format button to make it easier to read.
Cache TTL (Time to Live)
Cache TTL is the amount of time the end-users browser cache a query result for the chart. Only the owner of the query can configure it to set an auto-refresh interval. For example, if you are the owner of the query and set it to 24 hours, then a dashboard with charts built on top of this query will automatically refresh the charts every 24 hours.
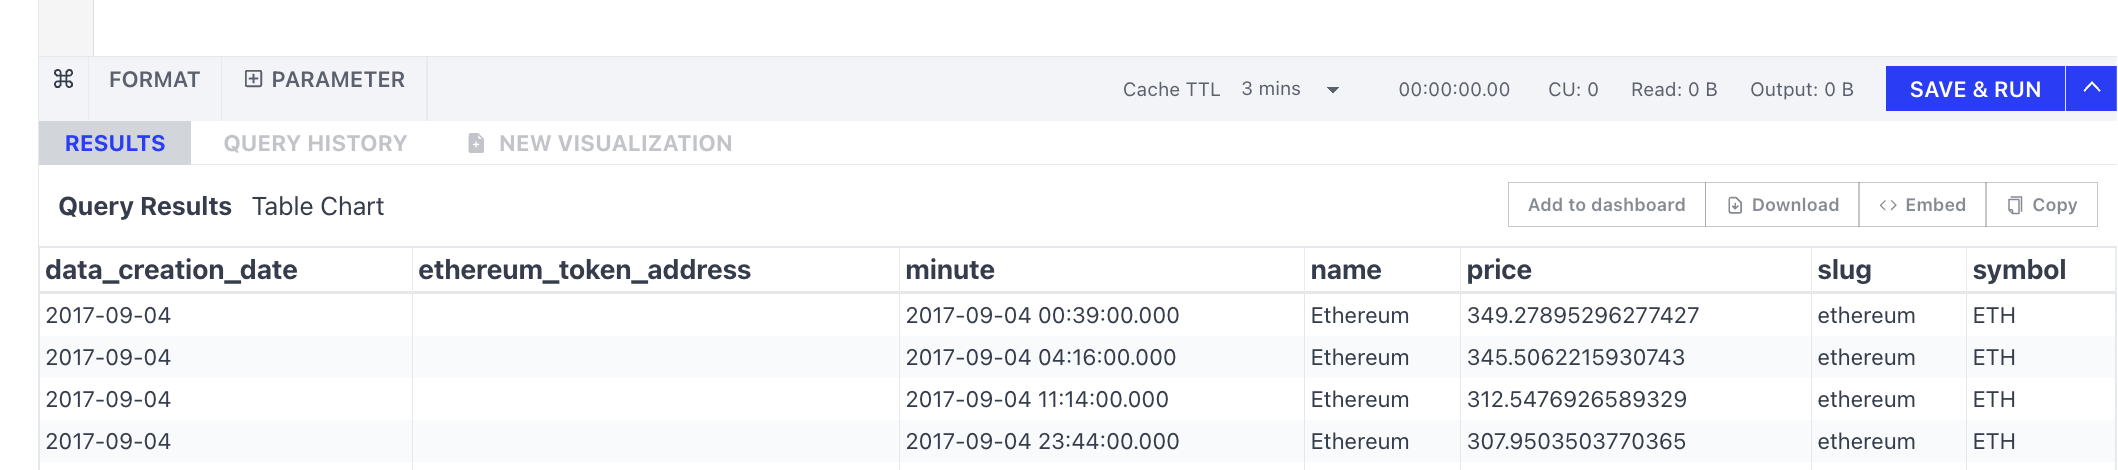
3. Query Results
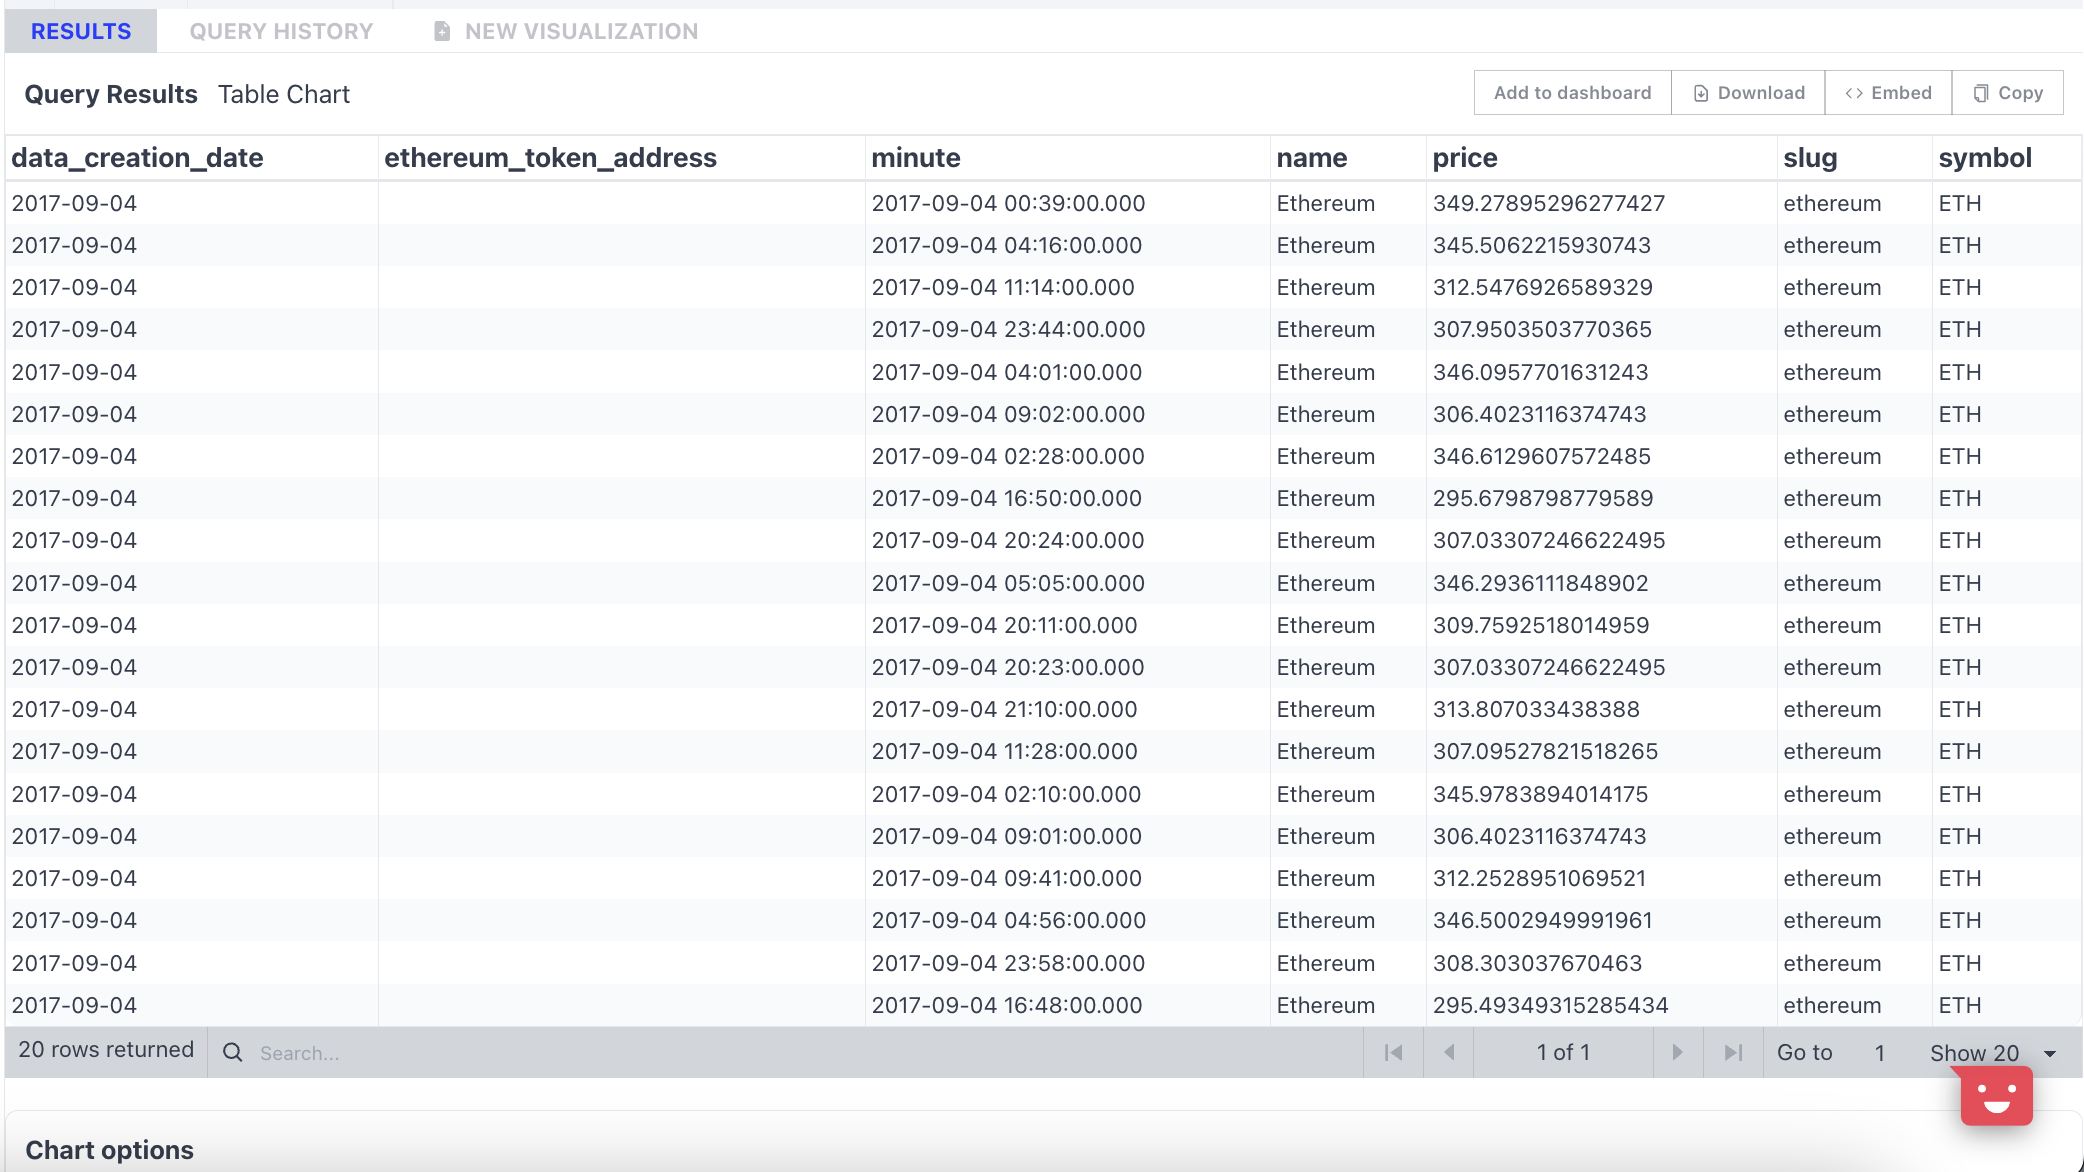
Query Results is the place where results are displayed, and you can further export the data and create visualizations.
Results Actions
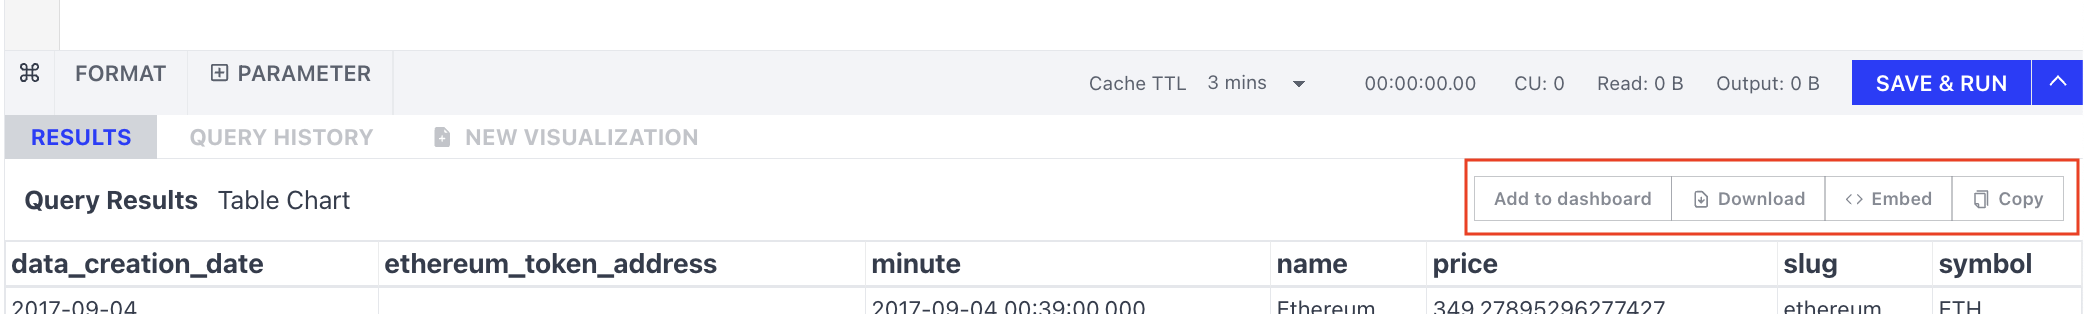
- Add to dashboard: Add the table results directly to your dashboard.
- Download: download results in CSV format; only available for table charts.
- Embed: embed result charts in other web pages; available for any charts.
- Copy: copy results to your clipboard in CSV format; only available for table charts.
Query history
It can be used to see the detailed logs of query history, including STARTED, DURATION, ROWS, SQL.
There’re 2 actions you can:
- Open a new window: will open a new window with this script.
- Copy to your pad: will copy the script into your pad, so you can further edit it.
Visualization
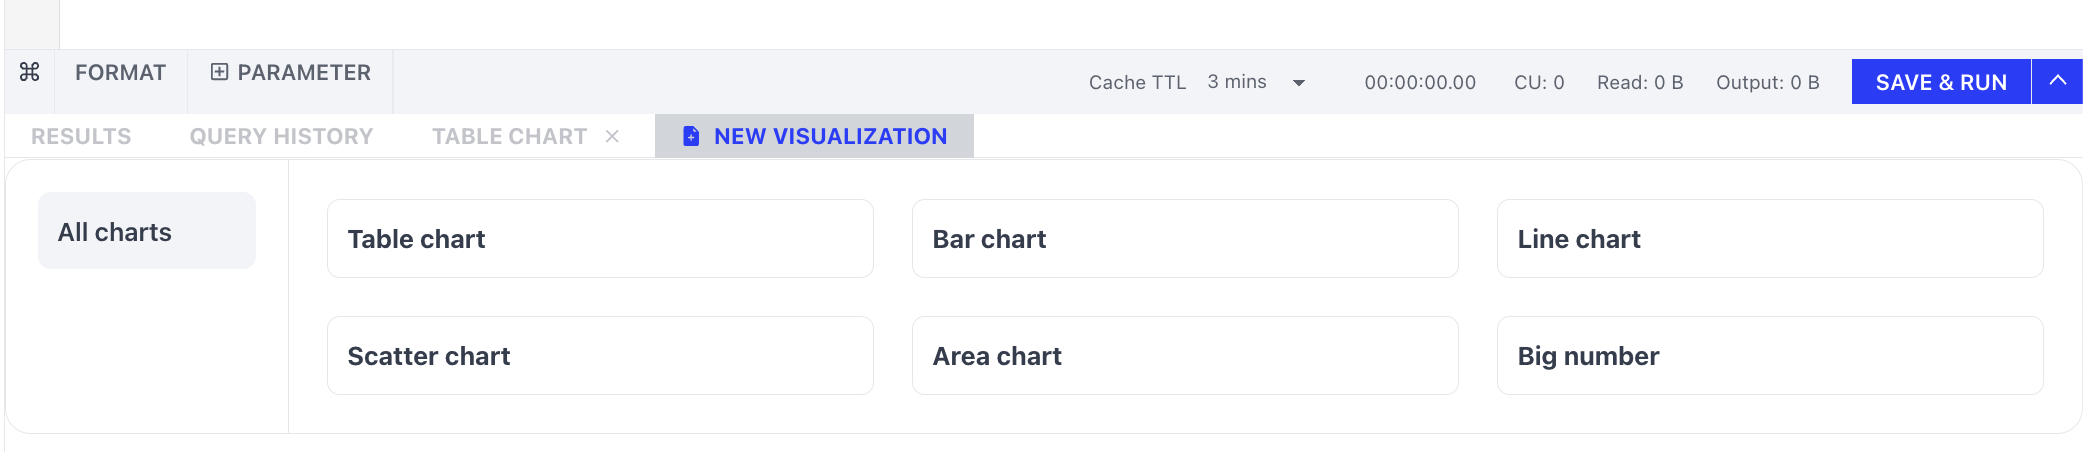
You can click New Visualization to add different visualizations based on your query results, for example, create a bar chart, etc. For detail on visualization, check Charts.
4. Save Query

When saving a query, you will see this popup window where you can edit the Title, Description, Privacy setting for this query.
After saving it, this setting will be displayed above the query editor:

- Setting: general settings include query title, description, and privacy.
- Publish: make your query visible to the community.
- Delete: delete this query.
- Star: shows how many people starred this query; you can click the button to add this query to your favorite list, so you can easily find it later on,
- Fork: replicate this query into your space, so you can edit and execute it directly
- Share: copy the link so you can share it with your friends.
Updated 10 months ago