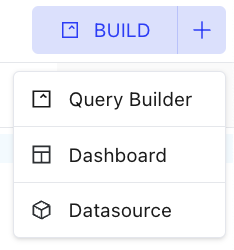
Dashboards
Clicking on the “Dashboards” button will take you to ZettaBlock’s Dashboards page. Dashboards are a feature for you to save different data visualizations in one location, while also enabling you to easily share them with others.
Creating a New Dashboard
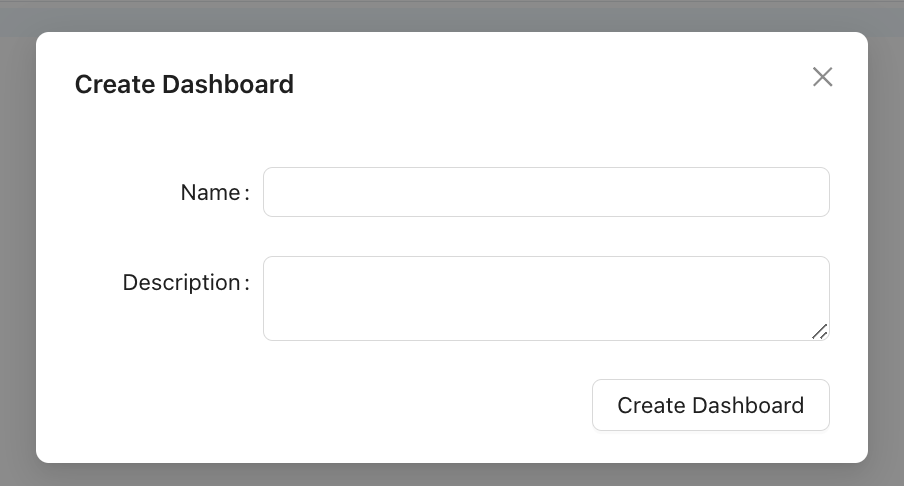
In the New Dashboard pop-up window, you can type the New Dashboard’s Name and add the Description for the New Dashboard.
Editing Dashboards
Once you create a new dashboard, you can use the following features to edit the page based on your need.
Adding Visualizations
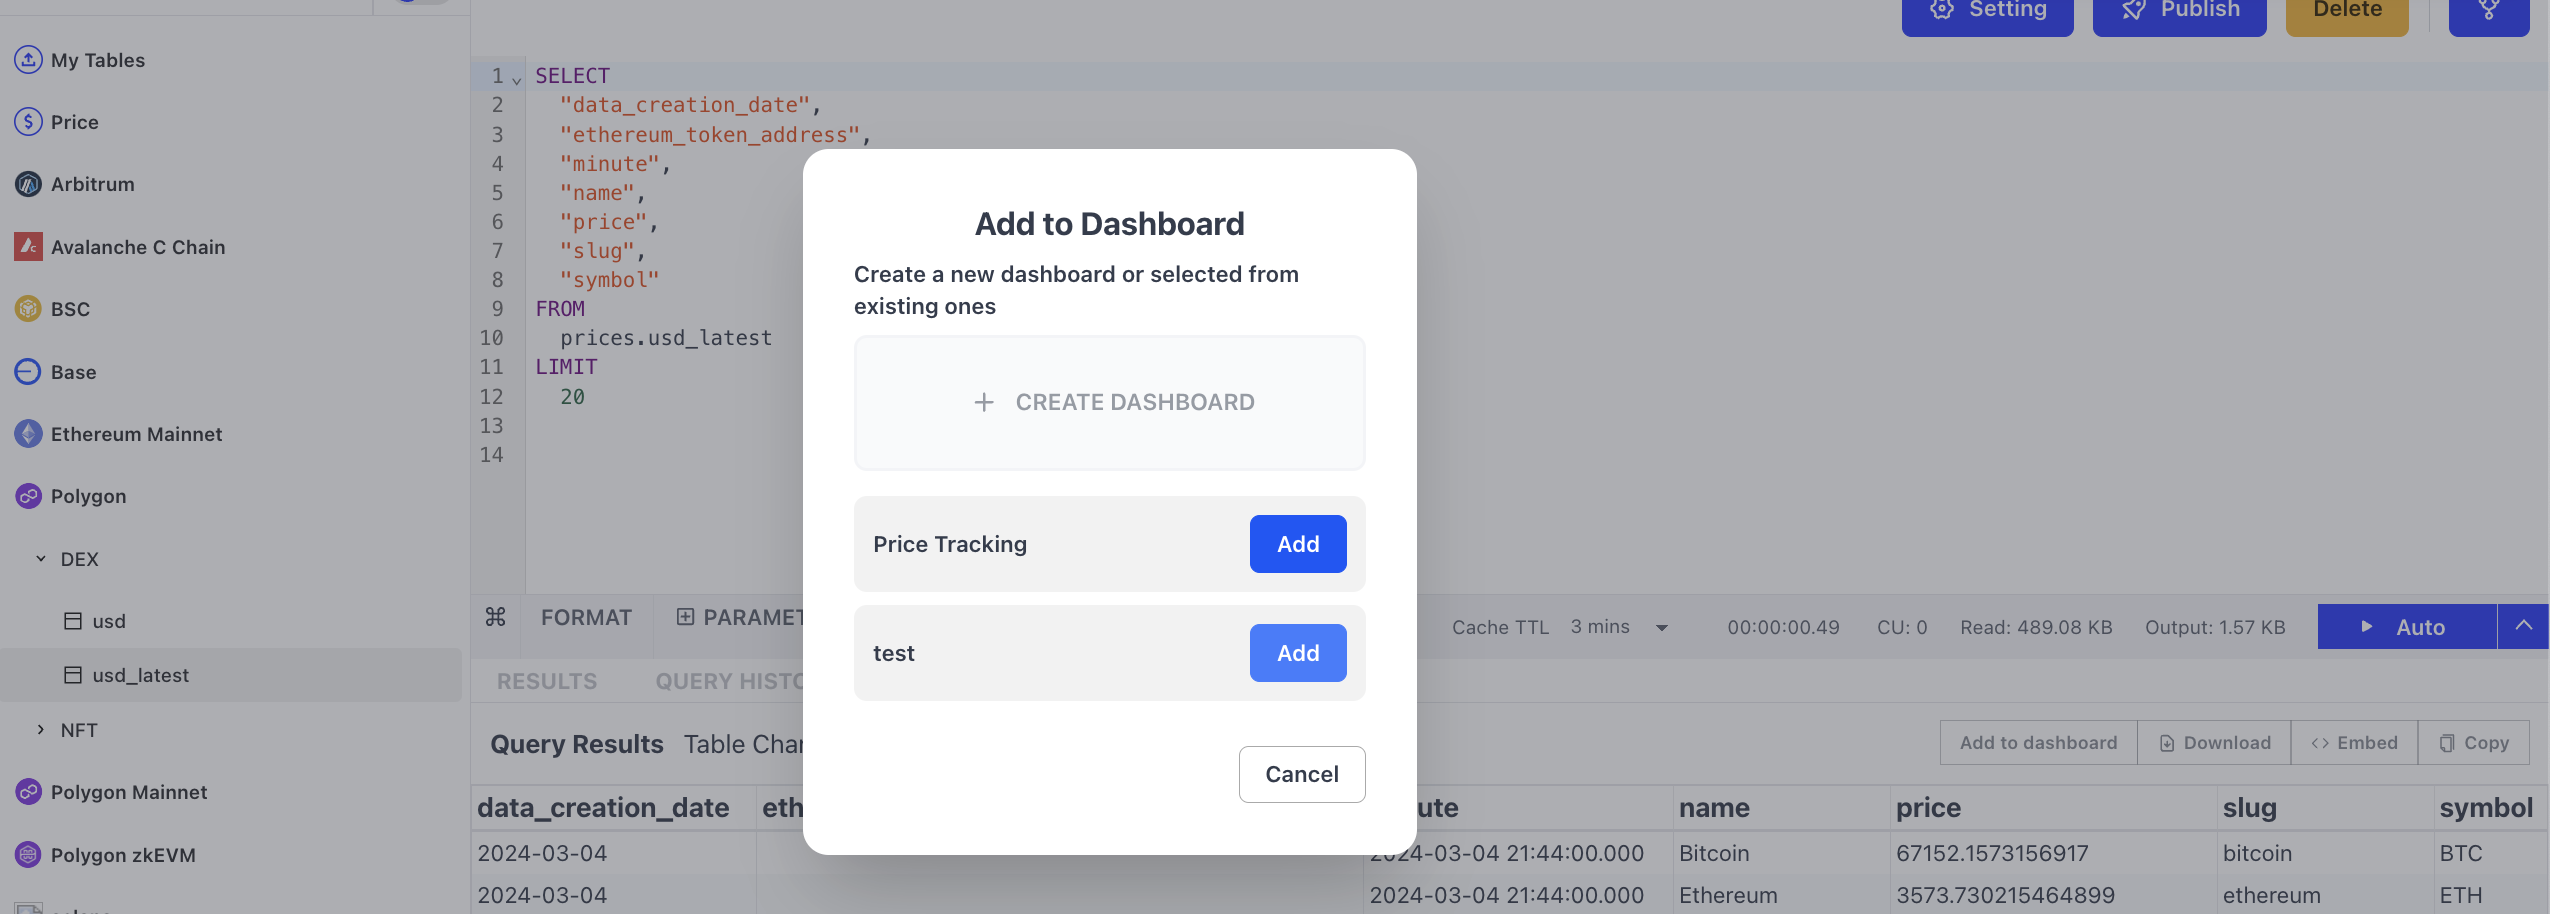
By clicking Add to Dashboard, you'll be prompt to select which chart to add into this dashboards.
Adding Text Widgets
By clicking Add Text Widget, you'll be prompt to create a text widget. Note that Markdown is supported.
Editing Widget positions and sizes
You can adjust the size of the charts by clicking and holding the arrow in the right corner. Also, you can edit the positions by dragging the charts.
Saving

Utlize the same settings as in the query builder.
Using dashboards
Interacting with Charts
a. Edit and apply parameters
You can change the parameters of each chart, and the change will show up in the dashboards once you click APPLY PARAMS.
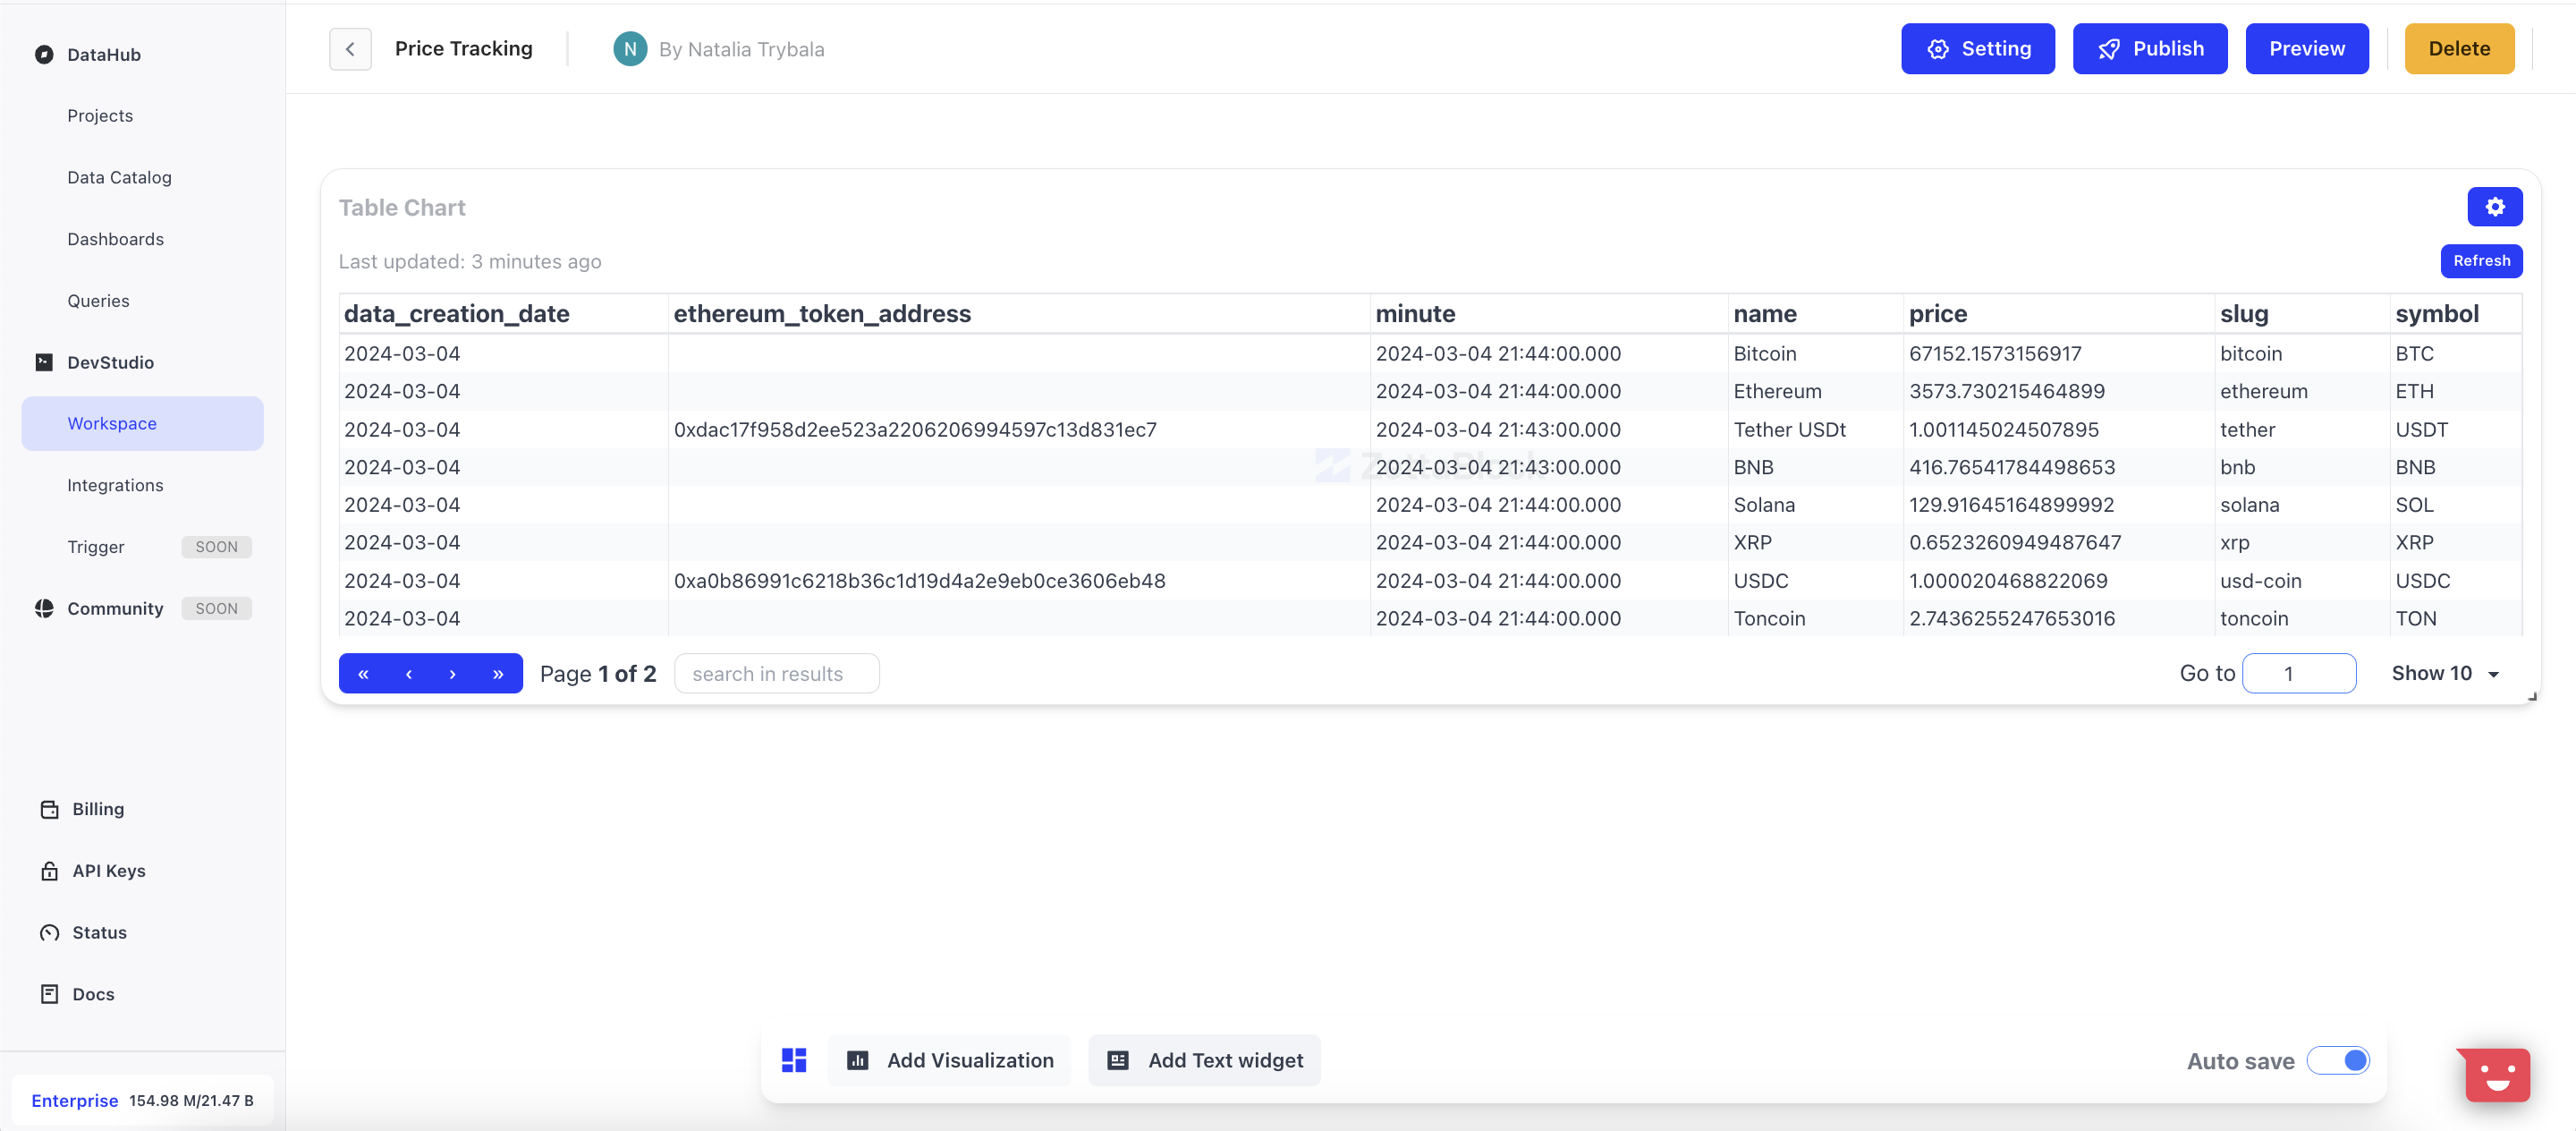
b. Table chart functions
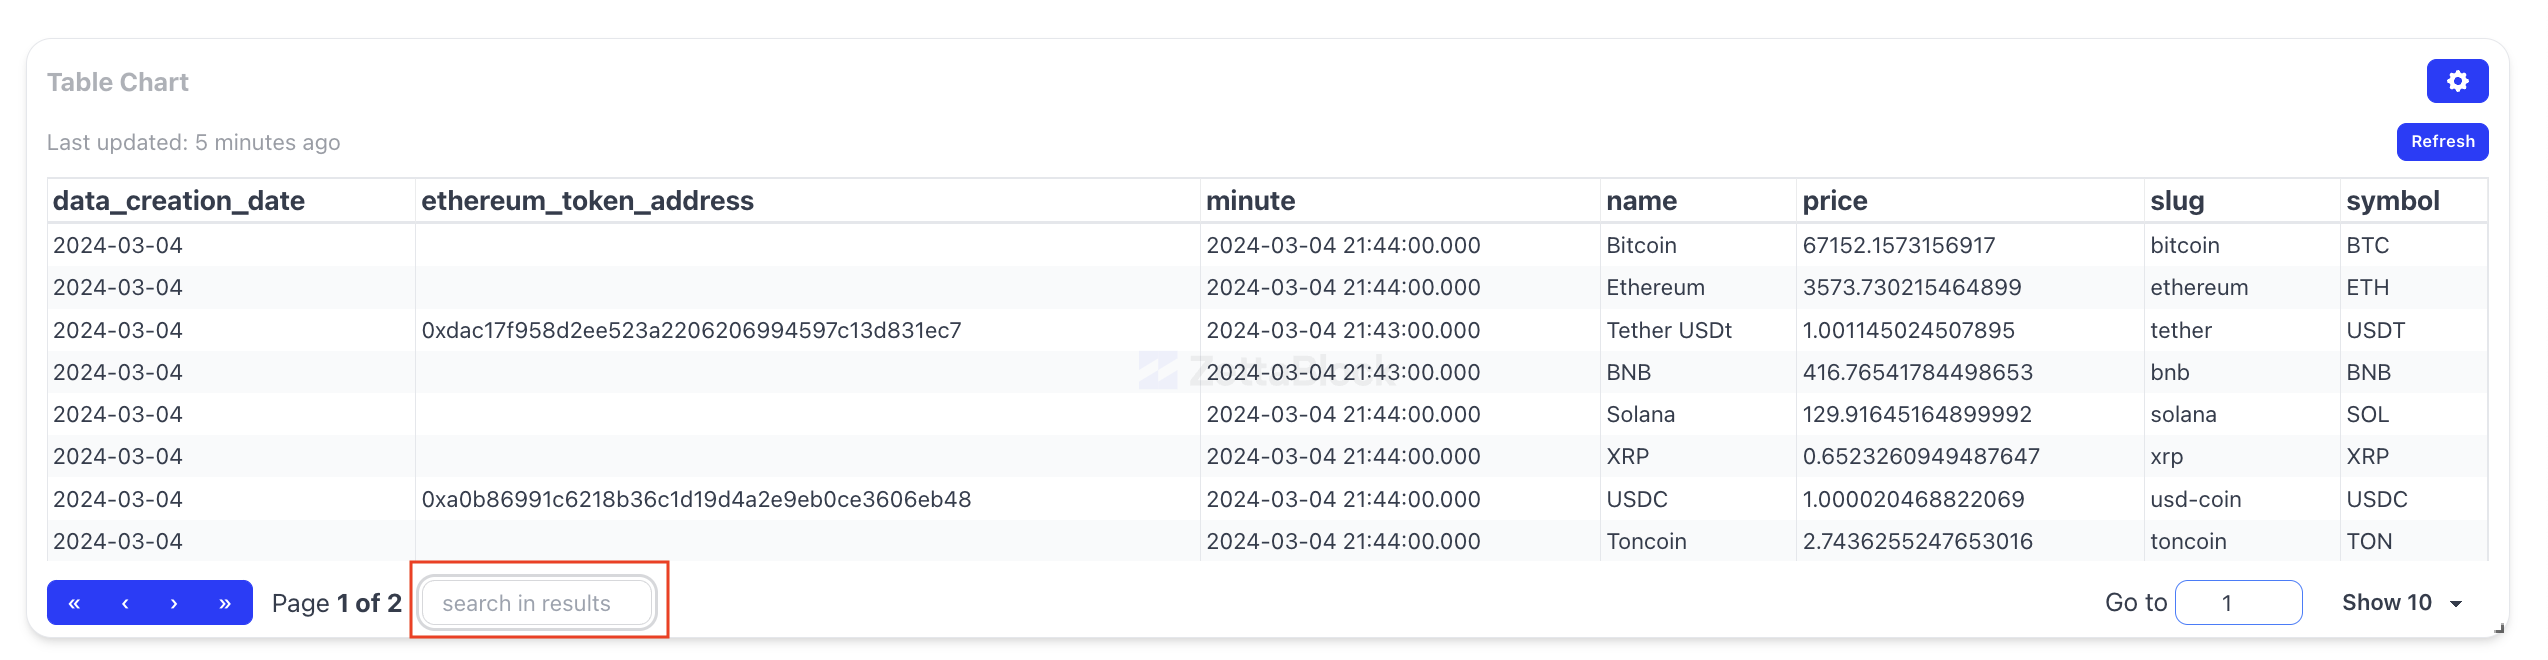
The Search, Go to, and Page View functions in the Table Chart work the same as on the dashboard. These three functions can help you to locate specific rows of interest.
Admin

- Setting: general settings include query title, description, and privacy.
- Publish: make your dashboard visible to the community.
- Preview: see how your dashboard will look like to others.
- Delete: delete this dashboard.
- Star: shows how many people starred this dashboard; you can click the button to add this dashboard to your favorite list, so you can easily find it later on,
- Share: copy the link to your clipboard so you can share it with your friends.
Updated 10 months ago