Compute Units
ZettaBlock simplifies accessing and querying Web3 data through a variety of services, each powered by Compute Units (CUs). CUs are the measure of computational resources consumed for SQL analytical queries, customized GraphQL APIs, Prebuilt GraphQL/REST APIs, and other data operations on our platform. Here's how billing is structured across different services:
| Type | Description |
|---|---|
| Prebuilt APIs | A list of out-of-box popular real-time APIs such as Token price APIs. |
| Query (Data Lake) | Perform analytics queries over our data lake. Billing is based on the volume of data scanned, ideal for operations like refreshing custom APIs or utilizing the Query Builder for custom analytics. |
| Query (Real-Time DB) | Execute real-time queries on our optimized database, with charges based on the volume of data scanned. |
| Custom GraphQL API | GraphQL APIs built by user. Charges are based on CU consumed per record. |
| Data Transfer Out | Charges for downloading data, such as query results, from cached storage solutions like Amazon S3. |
| Data Storage (custom APIs) | Costs associated with the storage of tables created for custom APIs, ensuring your data is readily available for queries and operations. |
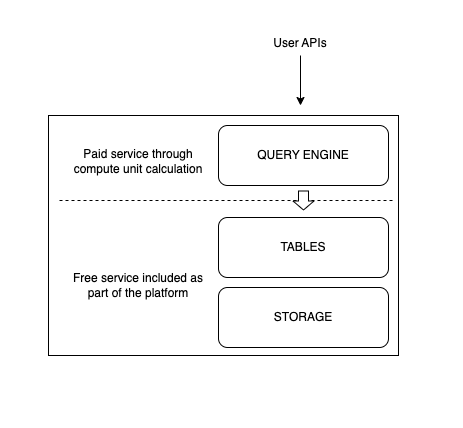
Compute Units, as defined on the platform, are used to measure the amount of resources used to create and run the above data operations. For example, running a query on ZettaBlock’s Query Builder, results in a call to our query engine which in turn starts off a data scan of the tables specified before producing a result for the user. Additionally, users can turn their analytical queries into GraphQL APIs using ZettaBlock’s DevStudio, which would involve the materialization and storage of the datasets within a virtual database for future API calls.

In the query example, compute units map directly to the data scanned when running the query as well as the time it took to fully execute the request. The same process occurs when compute units are calculated during the creation, data refreshing and usage of APIs. To clarify, compute usage units measure only the resources used to scan datasets and the execution time of queries within the query engine, while services related to data storage and the accessibility of tables are included as part of the ZettaBlock platform services.
Usage Overview
Considering how compute units are measured, let’s take a deeper dive into their account usage metrics within the Usage management section. The compute unit usage overview gives you access to the API usage metrics for all users under a specific account or organization if you purchase an enterprise plan.
There are two metrics detailed in this section, the Total Compute Units Used and the Prepaid Compute Units recorded in the last 30 days.
Individual accounts

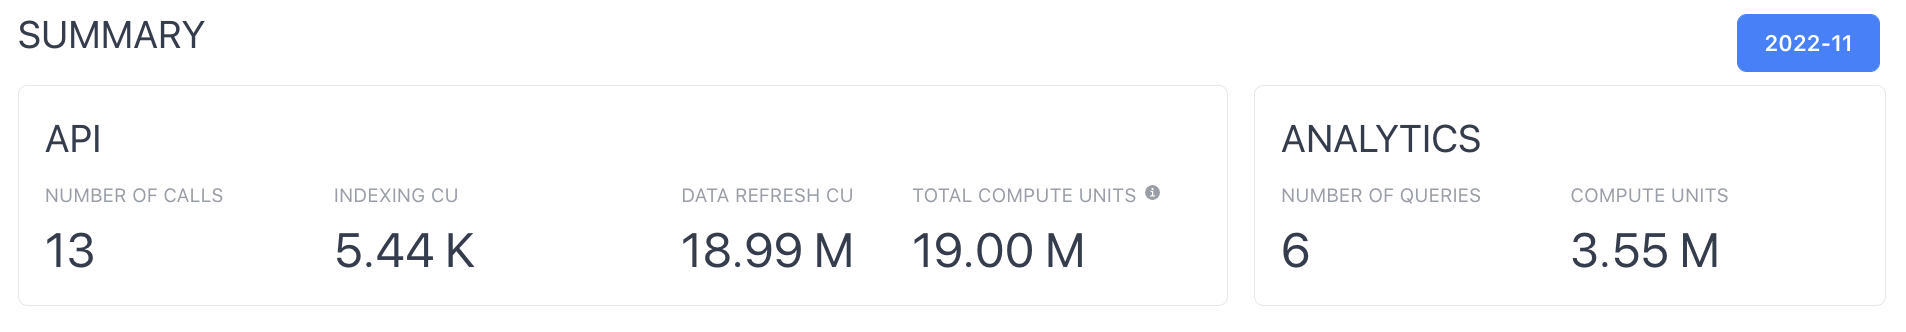
The example shown above illustrates an individual account and details the single main user and their usage in the last 30 days. Specifically, when reviewing the metrics for the last 30 days of usage, a user has access to a summary of the Total Compute Units Used recorded in the last 30 days. The Total Compute Units Used refers to the total amount of computational units used to support all the calls, data indexing and data refreshes for all of the GraphQL APIs and analytical queries created within this individual account.
Organization accounts

In the case of organization accounts, the Total Compute Units Used refers to the total amount of compute units used to support all the calls, data indexing and data refreshes for all of the GraphQL APIs and analytical queries for all users under the organization. For example, as shown in the image below, imagine an organization with 3 main users. Each user has a record listing the number of queries they’ve run and the number of API calls made to the APIs they’ve created. These metrics are then aggregated together to calculate the total compute units used by the organization in the last 30 days.
Compute Units Usage Breakdown
Taking a deeper dive into user metrics, users also have access to the compute units usage summary. This summary offers a breakdown of individual account usage or an overview of the organization's overall usage in the case of enterprise plans.

The API section details an aggregated view of all usage with a categorisation of compute usage units for data indexing (Indexing CU), data refresh (Data Refresh CU) and data download (Data Download CU).
Data indexing cost is related to the resulting dataset size, including the size of indexes created by users during configuration of APIs for better performance during data retrieval. For example, you may create an API to understand pricing of recent transactions over the last 2 months, say the resulting dataset is X GB. During the API’s creation, you specify additional field indexing of the data using the transaction_hash to facilitate faster responses when the API is called, which adds the size of the transaction_hash index to the final dataset. If the size of indexes is small (which is most likely), then the cost will be proportional to the X GB instead of number of indexes the customer chooses.
The data refresh metric refers to how often the API is scheduled to refresh its base dataset as set in the initial configuration. Compute units calculated for data refreshes with no incremental refreshing (i.e. full dataset refreshes) are exactly the same as those used for analytics queries. If an incremental refresh is implemented, it drastically reduces the compute units required to process the data refresh.
The data download metric quantifies the compute units consumed for downloading datasets or query results from ZettaBlock. Charges for Data Download CU are based on the total amount of data transferred out of the platform. This enables users to efficiently manage and retrieve their data, whether for offline analysis, backup, or further processing outside ZettaBlock.

The last metric included in this section is the Number of API Calls. The Compute Units for API calls are calculated as the number of records pulled during a call multiplied by the compute usage per 100 records for the specific API. This calculation is dynamically calculated based on the records requested during an API call. As illustrated above, the CU per 100 records for each API is calculated by dividing the total dataset size by the number of records. Each API will have their CU per 100 records displayed within the API’s overview page.
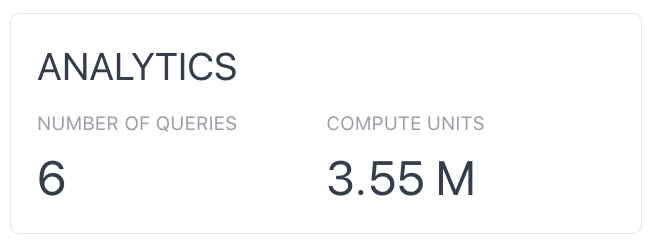
The ANALYTICS section refers to your organization’s usage of the ZettaBlock Query builder. There are 2 metrics listed - the Number of Queries and the Compute Units. Number of Queries relates to the number of queries, both for analytics and APIs, built and run on the platform, while the Compute Units relate to the resources used during each run of those queries. Note that a GraphQL API can also generate analytics compute units during the API’s creation. This is again calculated based on the amount of data scanned and the total execution time for these queries.

Underneath the summary section, users should have a breakdown of the metrics for API usage only. These metrics include the total API calls and compute usage units for data refresh and indexing. For each API, these metrics are added together to calculate the total compute usage units for each API.
Compute Unit Examples
Let’s review some examples of compute usage units in action.
Running a query on Data Lake
- Running a simple query (limit 20)
SELECT
  "project",
  "version",
  "transaction_hash",
  "block_time",
  "block_number",
  "log_index",
  "creator_address",
  "to_address",
  "contract_creator_address",
  "token_1",
  "symbol_1",
  "decimals_1",
  "token_2",
  "symbol_2",
  "decimals_2",
  "pair_address",
  "pair_symbol",
  "pair_decimals",
  "fee",
  "data_creation_date"
FROM
  dex.base_dex_pools
LIMIT
  20
Running the query for the first time obtains:
- Run time: 1465ms
- Data scanned: 120.59 KB
- Total CUs consumed: 8
Please note, that if you run the query for the second time, the size of the data scanned will be much smaller, hence the CU consumed will be lower.
Running the same query for the second time obtains:
- Run time: 221ms
- Data scanned: 7.78 KB
- Total CUs consumed: 4
- Running a complex query (based on this use case)
WITH
  dex_swaps_metrics AS (
    SELECT
      SWAPS.pair_address,
      SWAPS.from_address_tx AS wallet,
      pools.pair_symbol,
      pools.token_1 AS token_1,
      pools.token_2 AS token_2,
      pools.symbol_1 AS symbol_1,
      pools.symbol_2 AS symbol_2,
      SUM(SWAPS.amount_usd) AS volume_usd
    FROM
      dex.ethereum_dex_swaps AS SWAPS
      LEFT JOIN dex.ethereum_dex_pools AS pools ON SWAPS.pair_address = pools.pair_address
    WHERE
      SWAPS.data_creation_date >= CURRENT_DATE - INTERVAL '3' DAY
    AND swaps.amount_usd is not null
    GROUP BY
      1,2,3,4,5,6,7
  ),
  top_contributors AS (
    SELECT
      *,
      SUM(volume_usd) OVER (PARTITION BY pair_address) AS total_volume,
      CAST(volume_usd AS DOUBLE) / CAST(
        SUM(volume_usd) OVER (PARTITION BY pair_address) AS DOUBLE
      ) AS volume_contribution_ratio
    FROM
      dex_swaps_metrics
  ), possible_market_makers AS (
    SELECT
      DISTINCT pair_address
    FROM
      top_contributors
    WHERE
      volume_contribution_ratio >= 0.65 -- set your own threshold here
  )
SELECT
  pair_address,
  pair_symbol,
  token_1,
  token_2,
  symbol_1,
  symbol_2,
  ROUND(total_volume,2) as total_volume_usd,
  MAX(ROUND(volume_contribution_ratio,4)) as max_volume_contribution_ratio
FROM
  top_contributors
WHERE
  pair_address NOT IN (
    SELECT
      pair_address
    FROM
      possible_market_makers
  )
AND total_volume < 100000000 -- volume less than (set your threshold here)
GROUP BY 1,2,3,4,5,6,7
ORDER BY
  total_volume_usd DESC
For the first query run, the metrics for the above query are as follows:
- Run time: 8.08s
- Data scanned: 149.64 MB
- Data output: 850.10 KB
- Total CUs consumed: 9467
If you run the same query for the second time, the metrics will be as follows:
- Run time:1100ms
- Data scanned: 0 MB
- Data output: 850.10 KB
- Total CUs consumed: 388
Running a query on Database (real-time)
- Running a simple query (limit 20)
SELECT
  "name",
  "symbol",
  "slug",
  "price",
  "minute",
  "ethereum_token_address",
  "data_creation_date"
FROM
  prices.usd_latest
LIMIT
  20
The metrics for the above real-time query are as follows:
- Run time: 54 ms
- Total CUs consumed: 35
- Running a complex real-time query (based on this use case)
-- The following SQL tracks one of many addresses associated with Renzo ETH deposits, not all of them.
WITH deposit_value as (
select
  SUM(value/POW(10,18)) as amount,
  block_date as date
FROM ethereum_mainnet.traces as t
WHERE t.from_address = '0x093f6c270ac22ec240f0c6fd7414ea774ca8d3e5' -- Renzo Protocol EigenLayer: Eigen Pod Implementation address
AND t.to_address = '0x00000000219ab540356cbb839cbe05303d7705fa' -- beacon deposit address
AND substr(t.input, 1,10) = '0x22895118'
GROUP By 2
),
withdraw_value as (
select
  SUM(amount/POW(10,9)) as amount,
  block_date as date
from beacon_mainnet.withdrawals
WHERE address = '0x093f6c270ac22ec240f0c6fd7414ea774ca8d3e5' -- Renzo Protocol EigenLayer: Eigen Pod Implementation address
GROUP BY 2
),
agg_by_date as (
select
  date,
  -amount as amount
FROM withdraw_value

UNION ALL

select
  date,
  amount
FROM deposit_value
)
select
  DISTINCT
  coalesce(agg.date) as date,
  SUM(agg.amount) OVER (ORDER BY agg.date) as net_flow
FROM agg_by_date as agg
The metrics for the above real-time query are as follows:
- Total CUs consumed: 35
Note that for real-time queries, the query history will only show the number of CUs consumed (fixed at 35 CUs per query). You won’t be able to see the run time or the size of data scanned.
Calling an API
- Calling a Simple Data Lake API
SELECT *
FROM
  dex.base_dex_pools
LIMIT
  20
API Call results:
- Number of Records: 20
- Total CU per call: 21.522
Refresh:
- Scanned Bytes: 135460
- CU: 8.1276
- Execution Millis: 1747
Indexing:
- API Size in bytes: 7991
- CU: 0.011 for hour 2024-03-24 13:00:00 UTC (this relies on the current api size, so the CU changes over time)
- Calling a Complex Data Lake API (based on this use case):
API Call results:
- Number of Records: 200
- Total CU per call: 83
Refresh:
- Scanned Bytes: 195964963
- CU: 11757.89778
- Execution Millis: 7896
Indexing:
- API Size in bytes: 861363
- CU: 1.1963375 for hour 2024-03-20 12:00:00 UTC (this relies on the current api size, so the CU changes over time)
Calling a Prebuilt API
Example: “Get the last 10 block details” for real-time Ethereum data:
query MyQuery {
  blocks(orderBy: number, orderDirection: desc, first: 10) {
    block_date
    difficulty
    extra_data
    extra_data_raw
    gas_limit
    gas_used
    hash
    logs_bloom
    miner
    mix_hash
    nonce
    num_of_transactions
    number
    parent_hash
    receipts_root
    sha3_uncles
    size
    state_root
    timestamp
    total_difficulty
    transactions_root
  }
}
Note that for real-time prebuilt and custom APIs, the CU consumption is fixed at a flat rate per each API call.
Updated 10 months ago