delete - Analyst: Build a dashboard
This document will guide your first steps on ZettaBlock and teach you how to create your first dashboard.
Step 1: Write SQL query
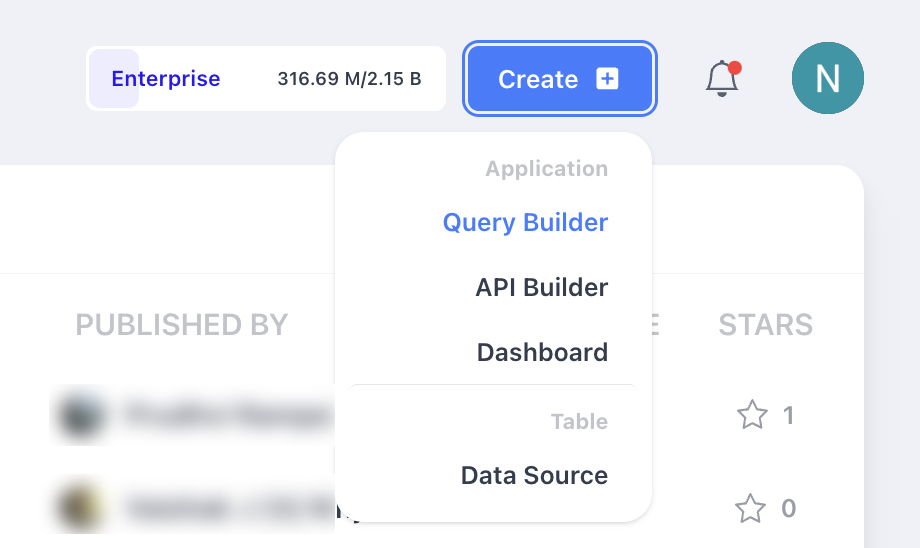
First, navigate to the Query Builder, shown below.
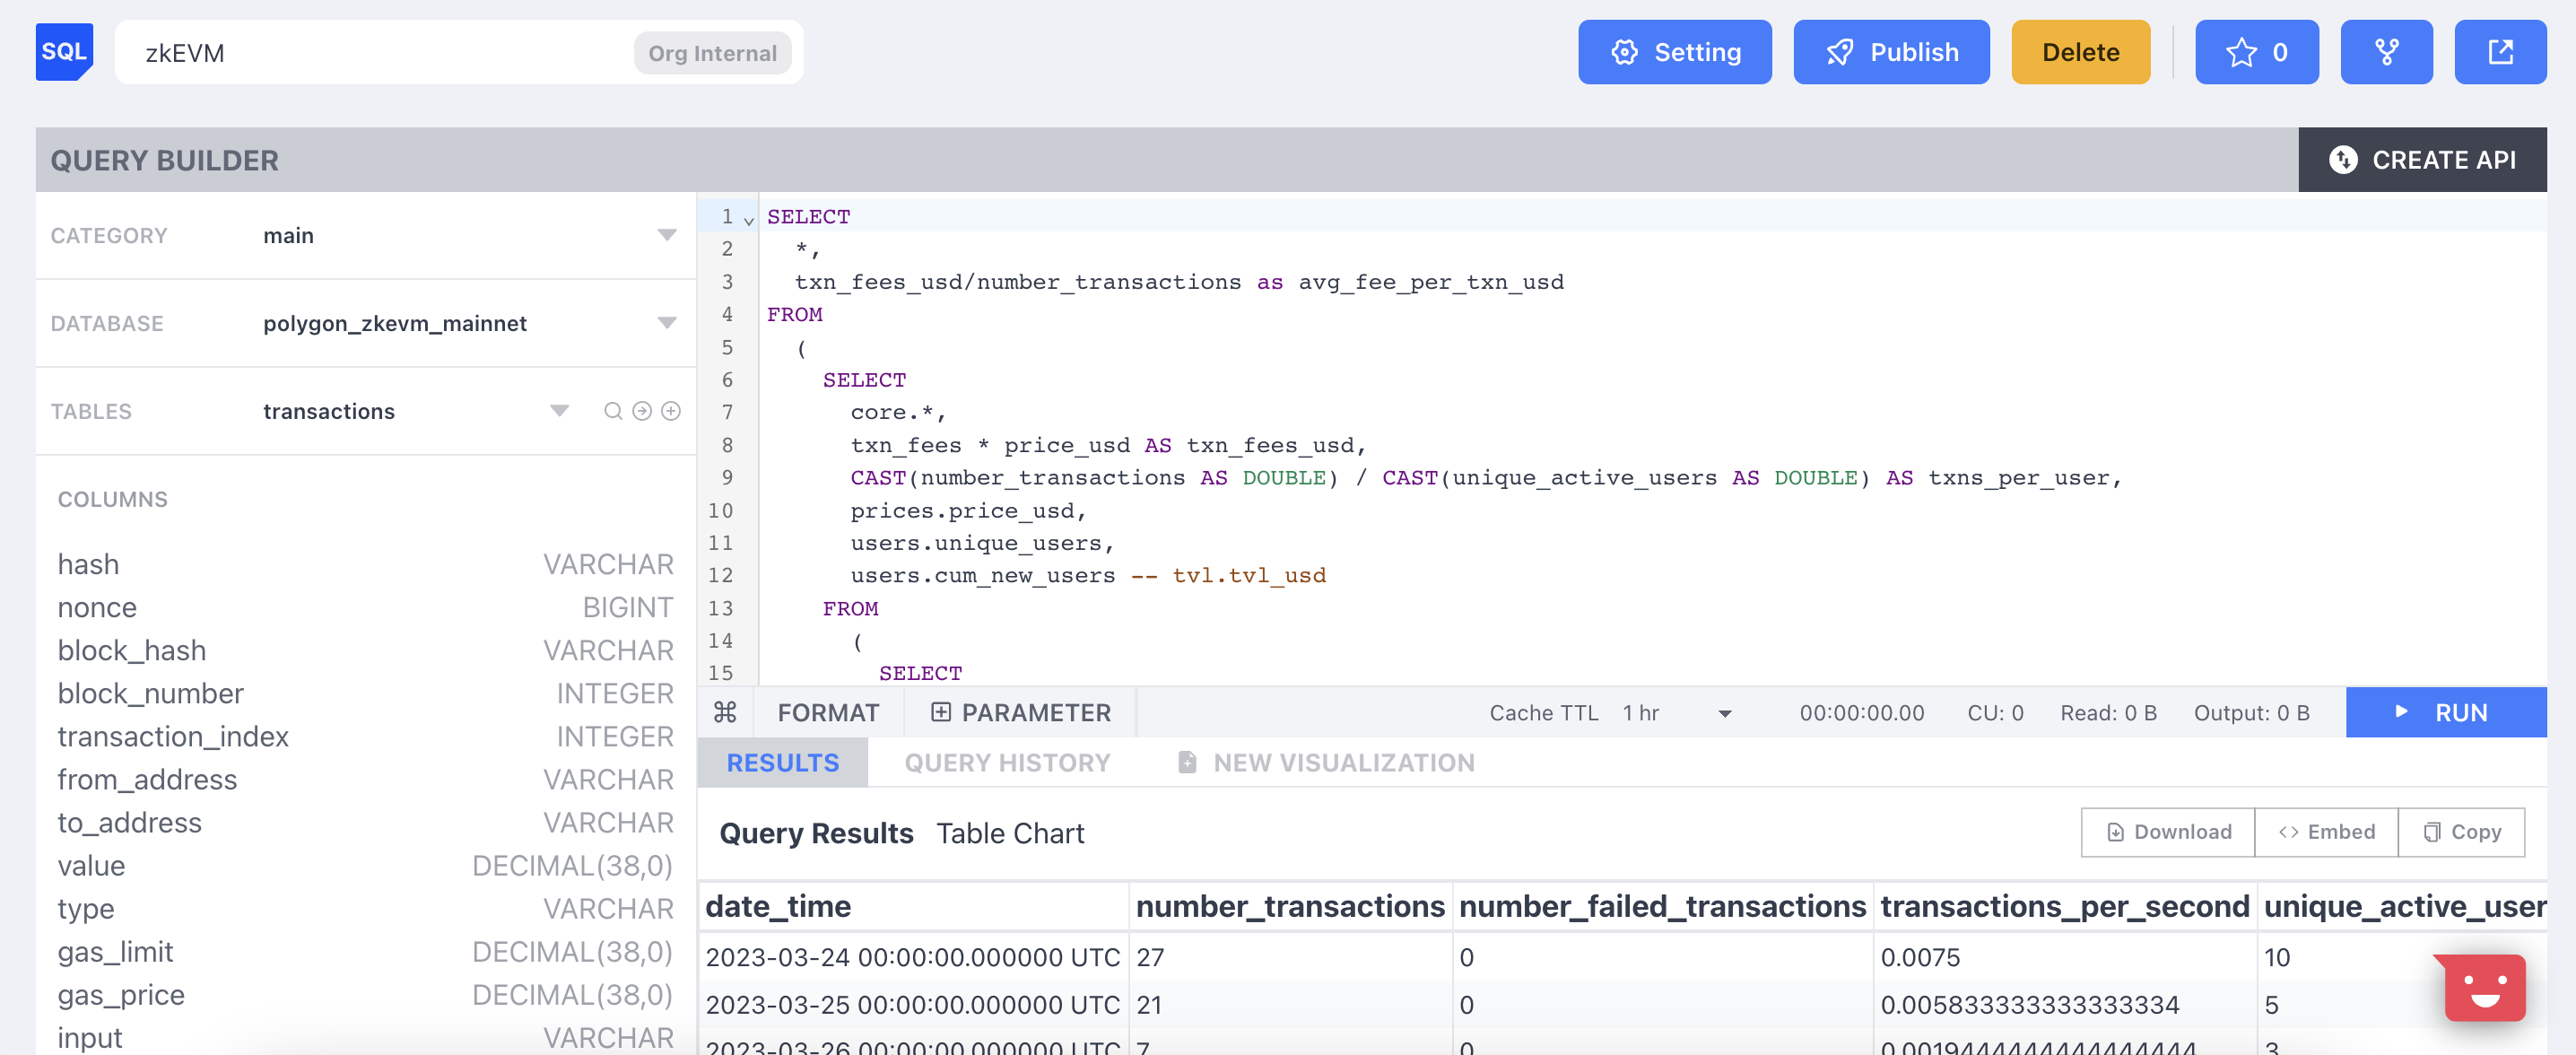
Once you open the Query Builder, your next step will be to choose which tables you want to use for your analysis. If you’re not sure what is included in each table, you can preview the content of each table, instead of running any SQL.
In this case, we’ll focus on the zkEVM Mainnet data.
Then, write your desired SQL statement. The SQL dialect is Presto SQL.
Here are some guidelines for how to write your first SQL query.
Step 2: Run the query and view the results
Once the logic is written, run the query and then view the results. The default view to see the results is in a table format.
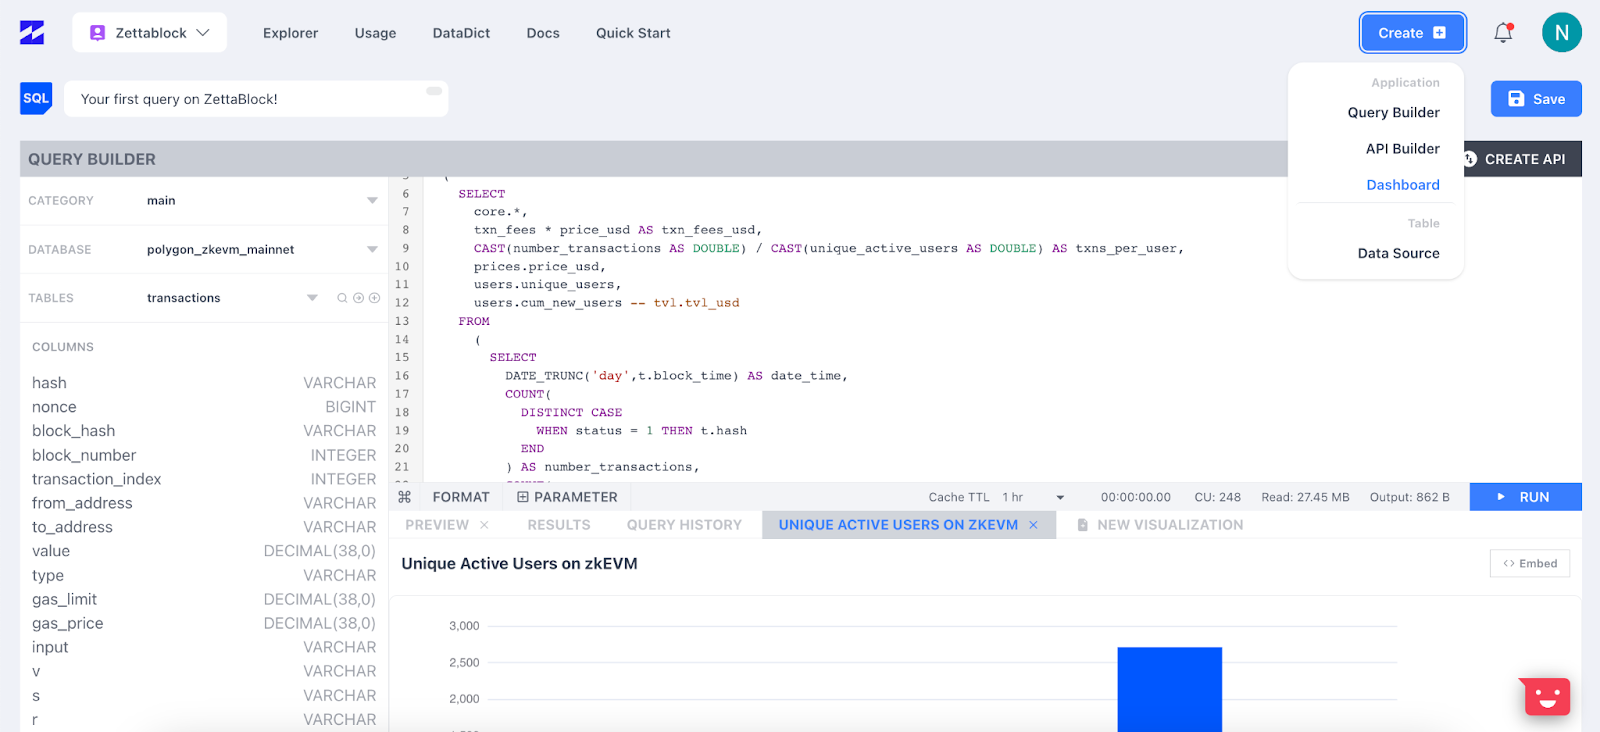
Step 3: Create visualizations
Once you’re happy with the results, it’s time to start creating material for your dashboard, i.e. visualizations.
You can choose between 6 types of visualizations. To learn more about the different types, visit this documentation.
In order to create a full dashboard, you’ll need to implement a few kinds of visualizations. Once you create a few, you can start making the full dashboard.
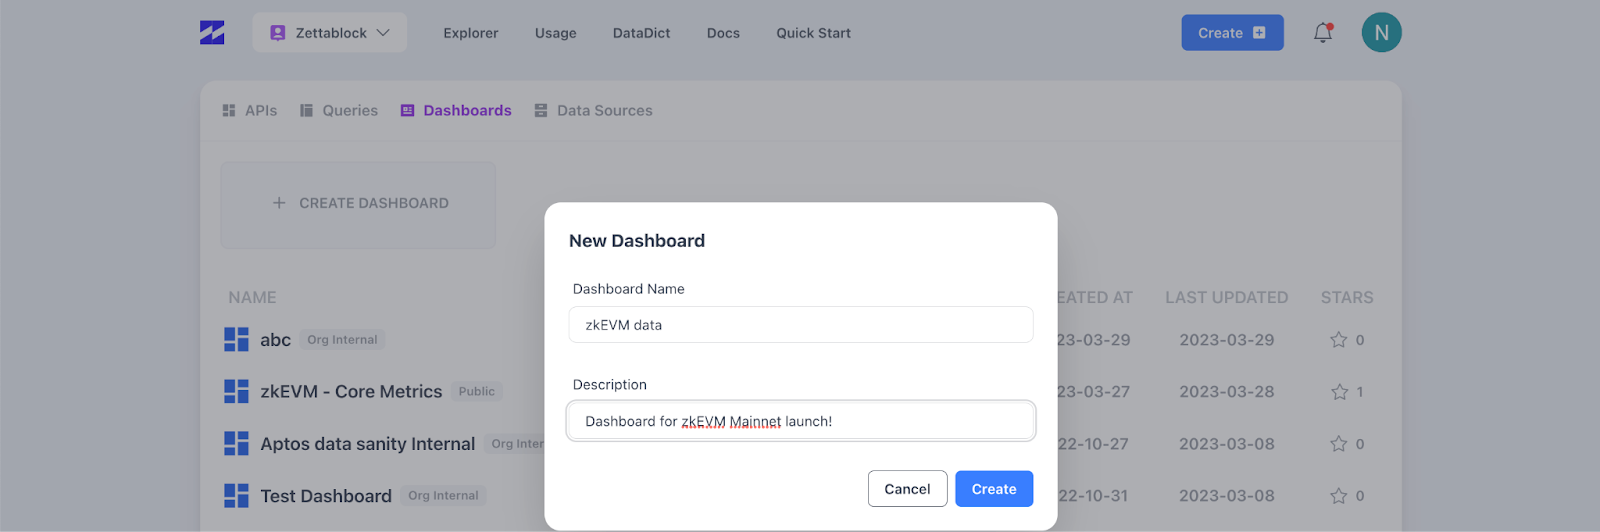
Step 4: Create a dashboard
Make sure to give your query a name and save it. Then, navigate back to the ‘Create’ button, and choose to create a dashboard.
Once you create enough visualizations, your dashboard will start looking a lot better!
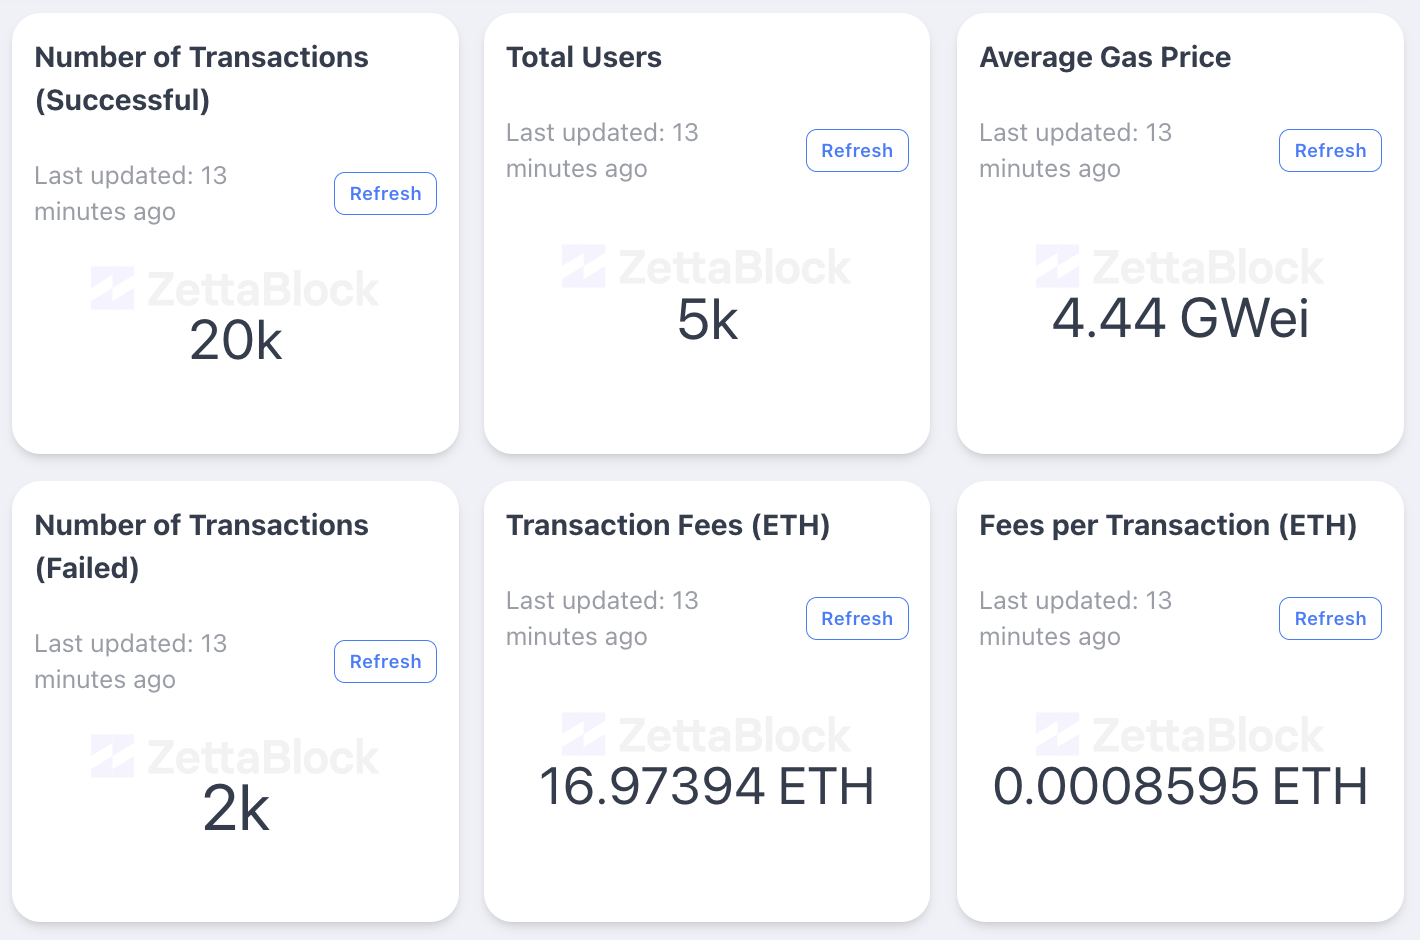
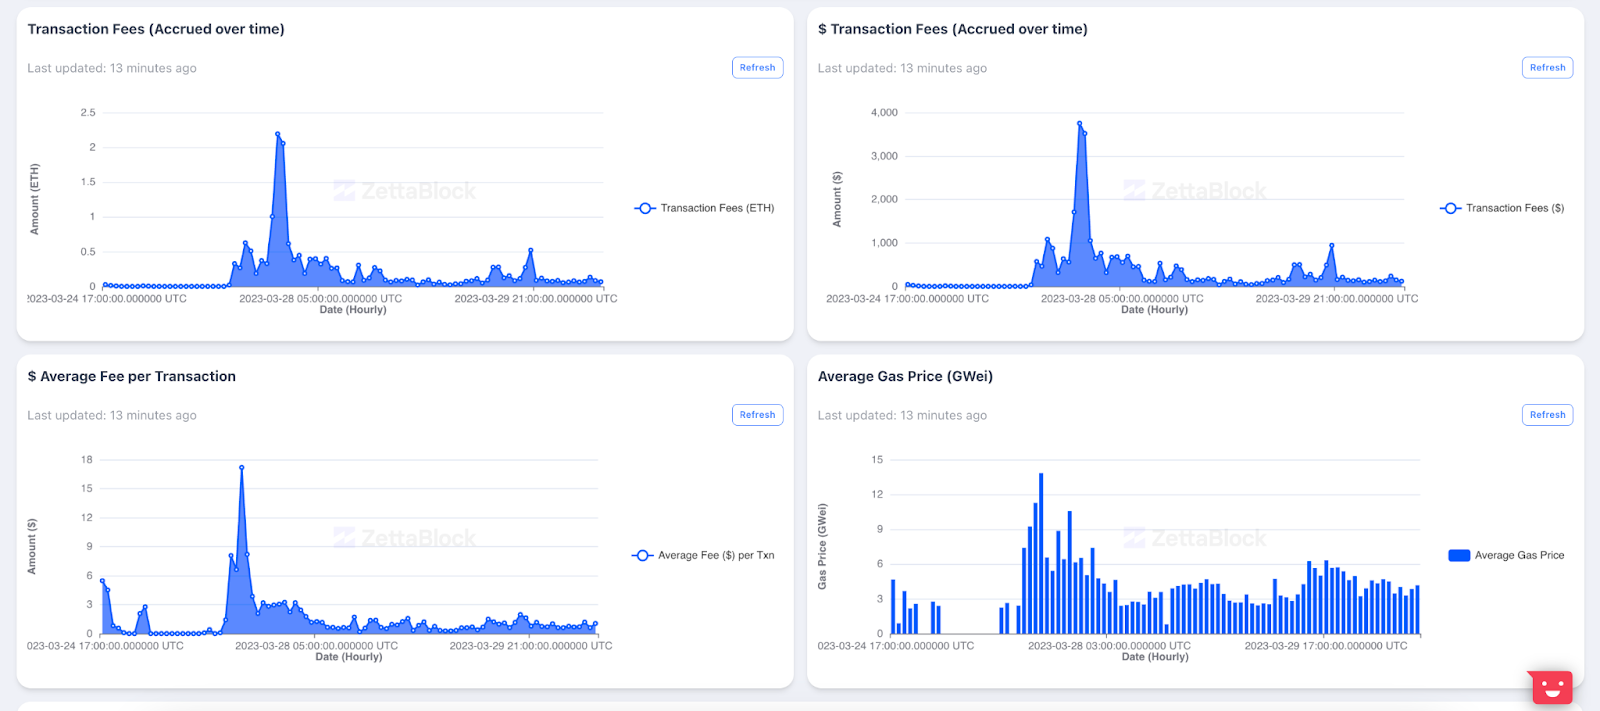
The final result, the zkEVM Mainnet Dashboard, can be viewed here.
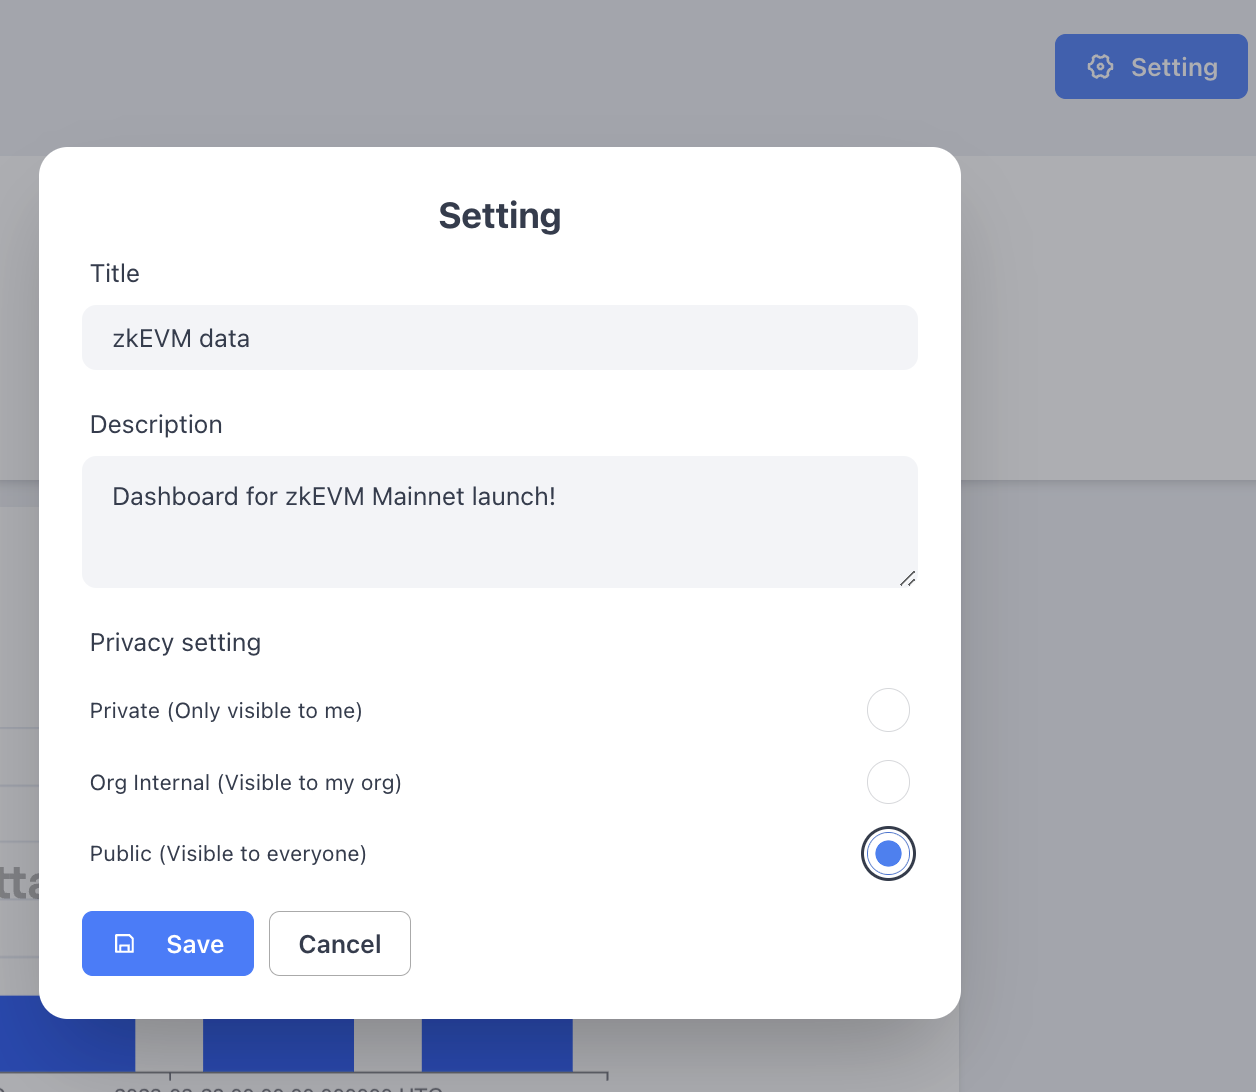
In the settings, you can decide who can view your dashboard. If you want to share it with the world, make sure to make it public!
And that’s it! Your dashboard is now live!
Updated 8 months ago